2012-2013 Bowl Blitz Invitational: Top 10 Teams in 30 Statistical Categories

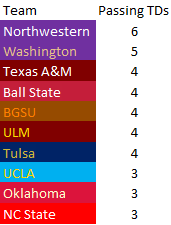
On this, the final day of entries for the 2012-2013 Bowl Blitz Invitational, we’re going out with few words but plenty of statistical reporting to consume.  This entry gives you the Top 10 Team results in 30 different statistical categories which were tracked over the course of this year’s project.  Read on to see which teams performed at the highest (and lowest, in terms of statistics like turnovers) level over this year’s 35 Bowl Games!

vlcsnap-2012-12-31-04h28m26s246

01 - Score

 02 - 1st Downs

03 - Total Offense

04 - Rushes

05 - Rushing Yards

06 -- Rushing TDs

07 - Completions

08 - Pass Attempts

09 - Passing Yards

10 - Passing TDs

11 - 3rd Down Conv

12 - 3rd Down Attempts

13 - 4th Down Conv

14 - 4th Down Attempts

15 - 2-point Conversions

16 - 2-point Attempts

17 - Red Zone Attempts

18 - Red Zone TDs

19 - Red Zone FGs

20 - Turnovers

21 - Fumbles Lost

22 - Interceptions

23 - Punt Return Yards

24 - Kickoff Return Yards

25 - Total Yards

26 - Punts

27 - Average Punt

28 - Penalties

29 - Penalty Yards

30 - Time of Possession

Leave a comment